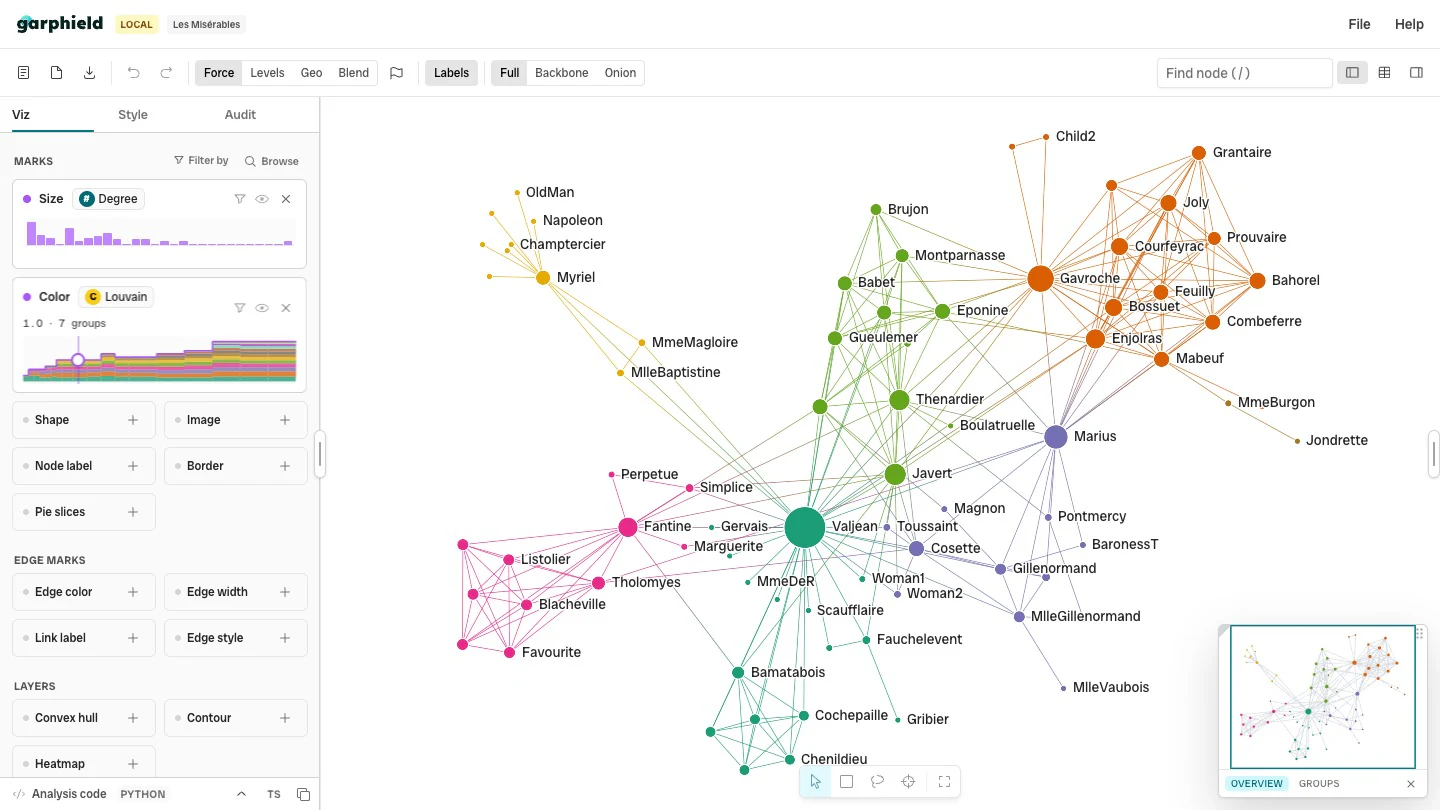

Garphield workspace tour
The canvas sits between the visual controls and the workspace panes.
- Top strip
- Visual controls
- Canvas
- Selection toolbar
- Workspace panes
- Minimap
Top strip
Section titled “Top strip”- File: Open data, load a sample, save a project, or export.
- Undo and redo: Move through recent changes.
- Table: Toggle the node and link tables.
- Layout: Choose Force, Levels, or a detected coordinate layout. Geo uses a map when the fields look geographic; other coordinates use the normal canvas.
- Labels: Toggle node labels.
- Search: Find a node or press / to focus the field.
Levels
Section titled “Levels”Levels arranges a graph in rows. Directed graphs follow edge direction where possible; cycles require some upward edges. Automatic mode compares layered placements for crossings, edges through nodes, and spacing after fitting the canvas.
Select one or more nodes, then click Levels to use them as roots. Every root starts on the top row. Rows follow shortest graph distance, ignoring edge direction; disconnected components get their own automatic roots. Clicking Levels with no selection returns to automatic layout.
Root IDs are saved in shared views and projects. Loading another dataset clears them. Changing selection does not rearrange the graph until you click Levels again. Levels appears directly, without the Force layout animation.
The command API also accepts explicit IDs:
window.garphield.run("layout.levels", { roots: '["a","b"]' });const result = await window.garphield.run("layout.wait");if (!result.ok) throw new Error(result.error.message);Use { levelAttribute: "stage" } to choose a property, { selectionAsRoots: true }
to use the current selection, or {} to return to automatic layout. Await
layout.wait after each request before reading positions or exporting an image.
When both options are supplied, explicit property values take precedence over root distances. Larger graphs use a bounded layout to keep interaction responsive.
Coordinates
Section titled “Coordinates”Coordinate layout is available only when the graph has a usable field pair. Garphield recognizes latitude/longitude names and formats, as well as original X/Y fields. Geographic evidence determines whether the layout uses a basemap; ambiguous X/Y pairs start on the plain canvas with a Use geographic map option.
A unique pair is selected automatically. If several pairs are compatible, choose the fields and click Apply. Nodes without usable coordinates are omitted from that layout along with their incident edges; the controls report how many nodes were placed. Imported coordinates remain available after running Force or Levels and when saving a project.
Visual controls
Section titled “Visual controls”- Viz: Add graph fields, algorithms, transforms, filters, and visual bindings.
- Style: Set the base appearance of nodes, links, labels, and the canvas. Choose Flat for the original fill, Lumen for soft relief, Sphere for complete balls, Prism for facets, or Sketchy for a hand-drawn double contour.
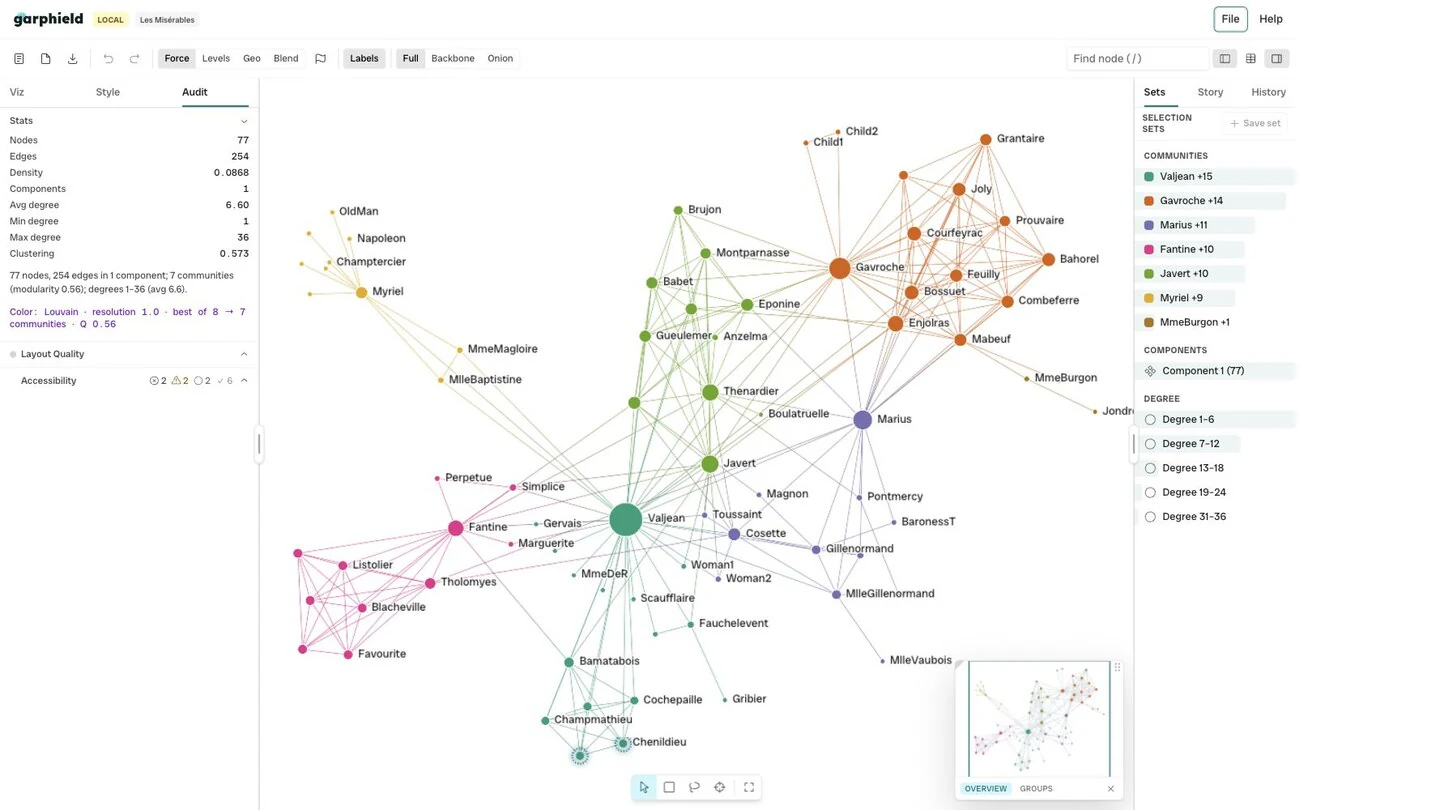
- Audit: Review graph statistics, layout measures, and accessibility checks.
Click Browser to find a source to drag, or click the pluses for any visual channel.
Canvas
Section titled “Canvas”Pan by dragging, zoom with a scroll wheel or touchpad. Any nodes that are dragged are persisted in the app.
Selection toolbar
Section titled “Selection toolbar”Minimap
Section titled “Minimap”The minimap shows the full network and the current camera area. Open Groups for a summary of communities or other computed groups.
Toggle the table using the button in the top right. There are tabs for nodes and links. Click the headers to sort. Node and link details can be changed inline.
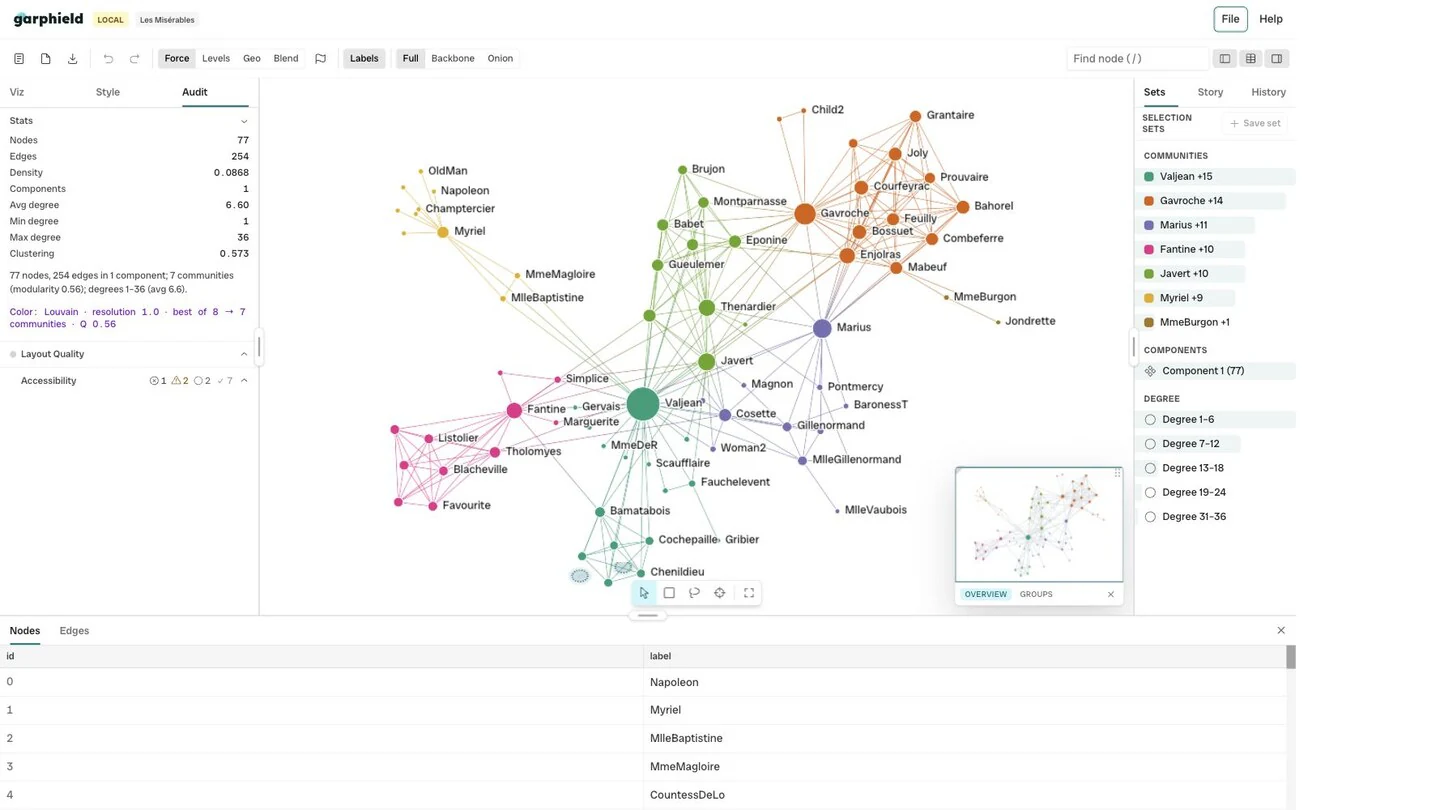
- Node and link tabs
- Sortable headers
Save a selection as a named set. Sets can be selected again, used as a filter, or assigned to a visual channel.
Audit collects graph summaries, drawing measures, and accessibility findings. Use it to check the network before you present or export it.
Story saves an ordered sequence of views. Each step can retain its camera, selection, annotations, and presentation state.
History
Section titled “History”History records graph edits, visual changes, filters, sets, and story changes. Select an earlier entry to return to that state.
Themes
Section titled “Themes”Garphield includes Light, Graphite, and Seafoam. Choose File → Theme to switch between them.
Seafoam takes its cue from industrial control rooms: a light mint-green canvas, solid green panels, and deep green lettering. Consistent outlines separate the controls, while full-width underlines identify active sidebar tabs and flat green fills mark selected tools. Search uses a lighter green field with dark text, and sidebar charts sit directly on their cards. Yellow warnings and red danger states keep their existing meanings. The documentation uses the same palette; use its theme button to cycle through the three themes.