

Make a dense network graph readable
Part 2 of Python to workbench and back.
Download the notebook project and open it in Garphield, or choose Open in Garphield from the notebook view.
Switch between Full and Backbone
Section titled “Switch between Full and Backbone”The Les Misérables graph has 77 nodes and 254 relationships. Backbone keeps the nodes and draws a structural edge set; Full restores every relationship.
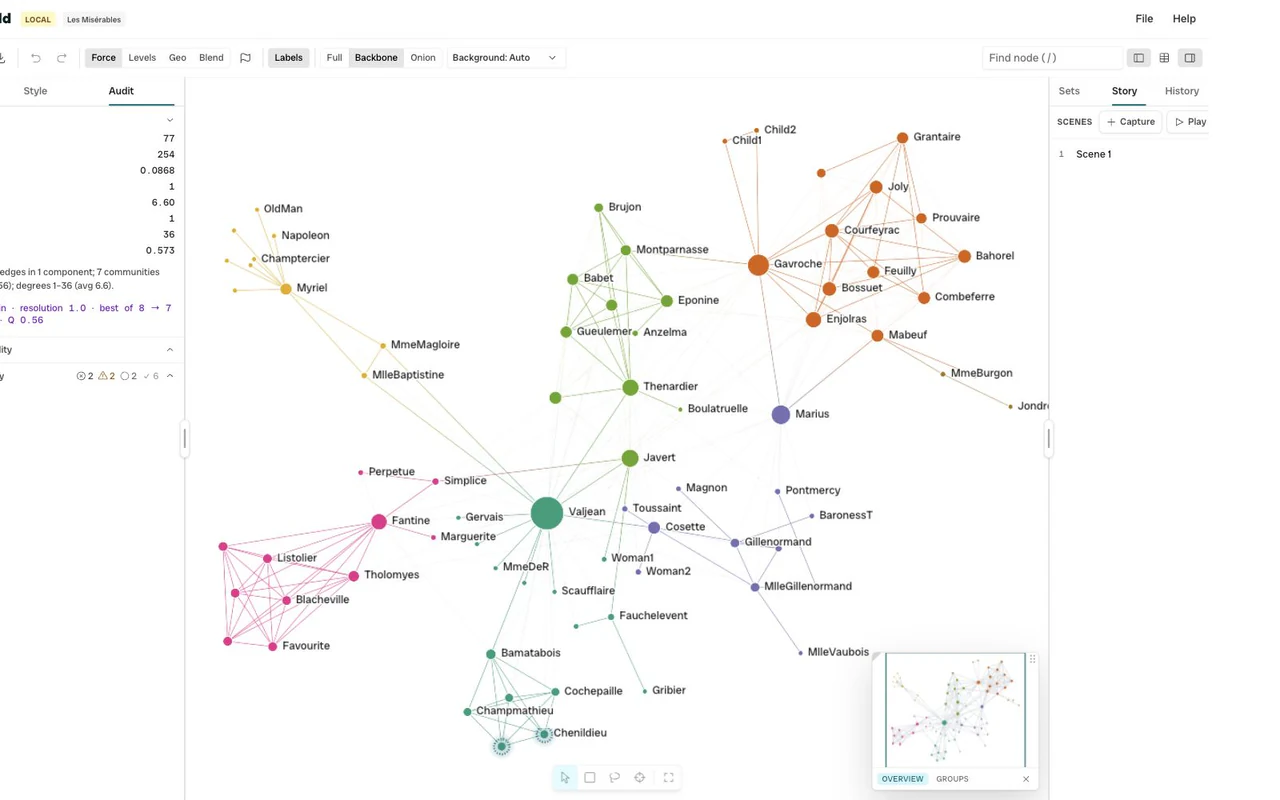
The switch changes the drawing, not the project. It does not alter exports or graph fingerprints.
const view = window.garphield.view();console.log(view.detail, view.rendered, view.hiddenEdges);Protect an arrangement
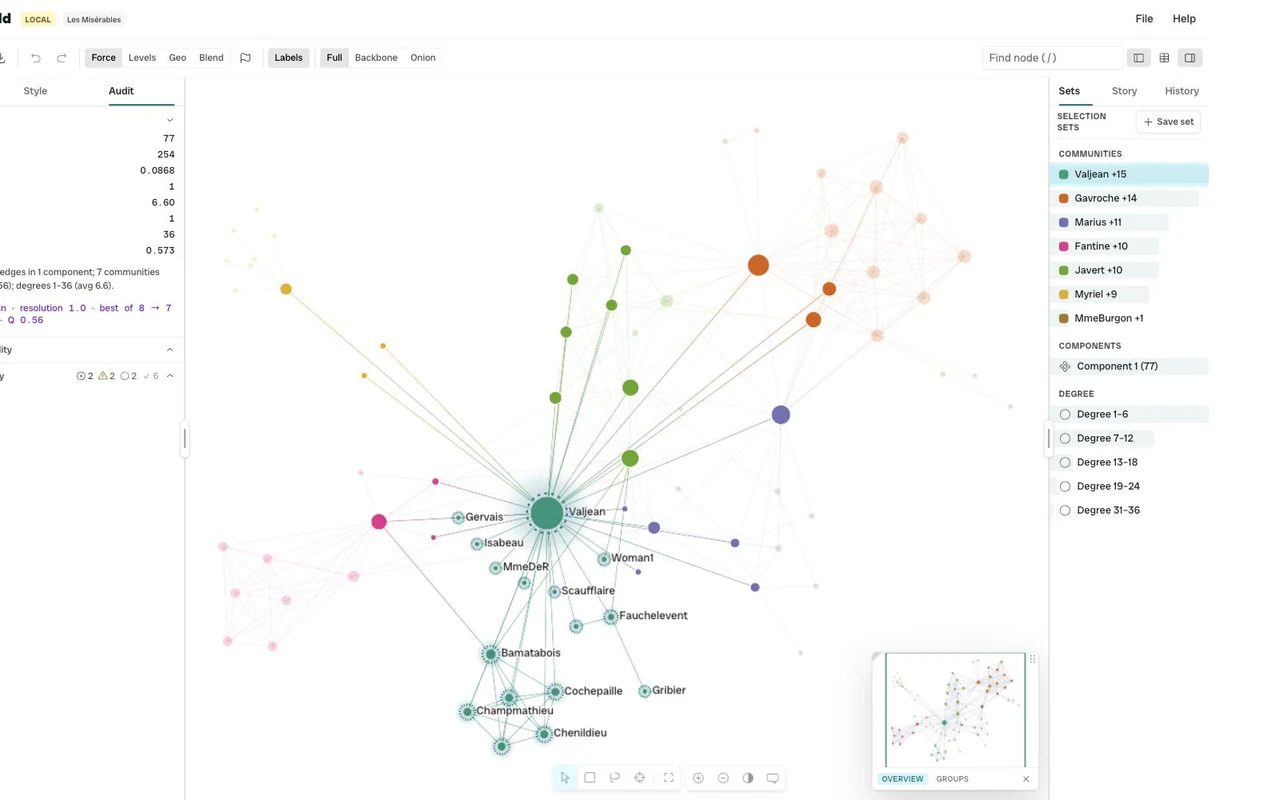
Section titled “Protect an arrangement”Select the nodes you have placed by hand, switch to Force, and relax everything around them:
window.garphield.run("layout.set", { mode: "force" });window.garphield.run("layout.relax", { hold: "selection" });Use hold: "others" to tidy only the selection instead.
Save the project or choose Return to notebook. The final part, Return to Python, compares what came back.